Analysis Level One: Location

Figure 3. Spread of the maximum likelihood estimates (MLE) of the audible detection of Common Nighthawk activity observed in habitats with (n=7) and without (n=9) artificial light based on 42-60 one minute recordings per location replicate.
|

Figure 4. Histograms displaying the frequency of vocalization (top) and wing boom (bottom) detection rates under light (n=7, left) and dark (n=9, right) treatments.
|
|
For the first level of analysis, the distribution of data was fairly normal with comparable variation between sample populations for each activity type (Figure 3). The control treatment (without light) saw a slight positive skew, particularly in vocalizations (Figure 4). There was more variation in the detection rate of Common Nighthawk vocalizations than wing booms (Figures 5 and 6). |

Figure 5. Residual plot of vocalization detection rates in lit (n=7) and unlit (n=9) habitats.
|
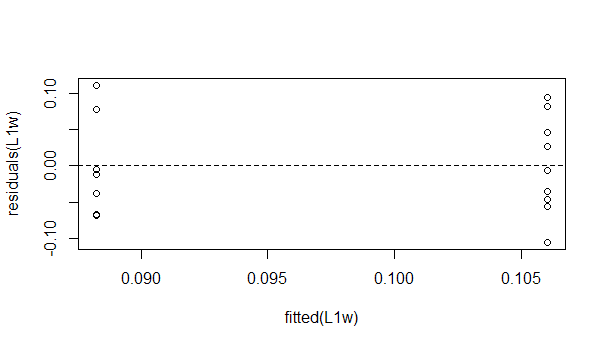
Figure 6. Residual plot of wing boom detection rates in lit (n=7) and unlit (n=9) habitats.
|
Analysis Level Two: Location x Sun Class
|
The control (dark) habitats saw a slight positive skew in observed vocalization detection rates throughout the active sun periods, while the treatment (light) habitats saw a negative skew during civil twilight (Figure 7). Typically, greater variation in the observed vocalization detection rates occurred at stations with artificial light (Figure 8). Overall, the greatest variation in the detection of Common Nighthawk vocalization rates occurred during the nautical twilight sun class periods in either sample population. The variation within and between treatment groups contributed to unequal variances, evident in the residual plot (Figure 9). These variances saw some correction with an inverse transformation (Figure 10). Slight skew is also observable in the residual plots. 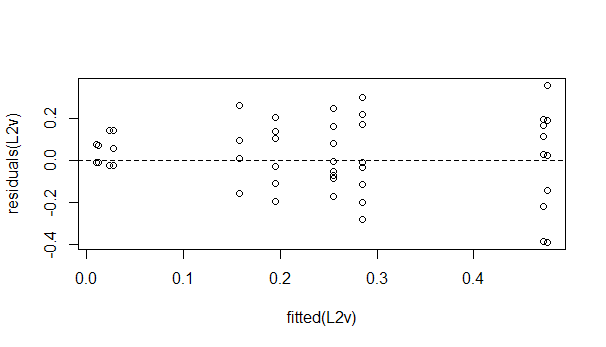
Figure 9. Residual plot of original vocalization detection rates in lit (n=7) and unlit (n=9) habitats, grouped by five sun periods.
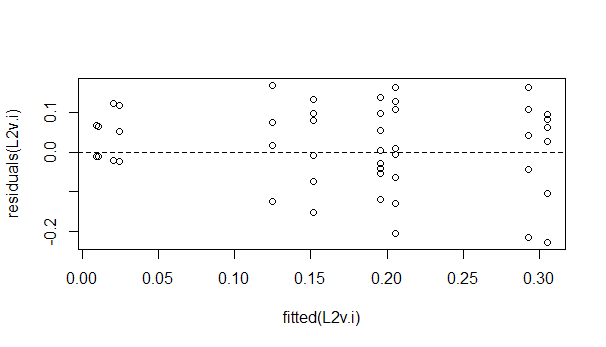
Figure 10. Residual plot of inverse-transformed vocalization detection rates in lit (n=7) and unlit (n=9) habitats, grouped by five sun periods.
|

Figure 7. Spread maximum likelihood estimates (MLE) of the audible detection of Common Nighthawk vocalizations observed in habitats with (n=7) and without (n=9) artificial light, with data grouped by sun period. Based on 10-12 one minute recordings per replicate.
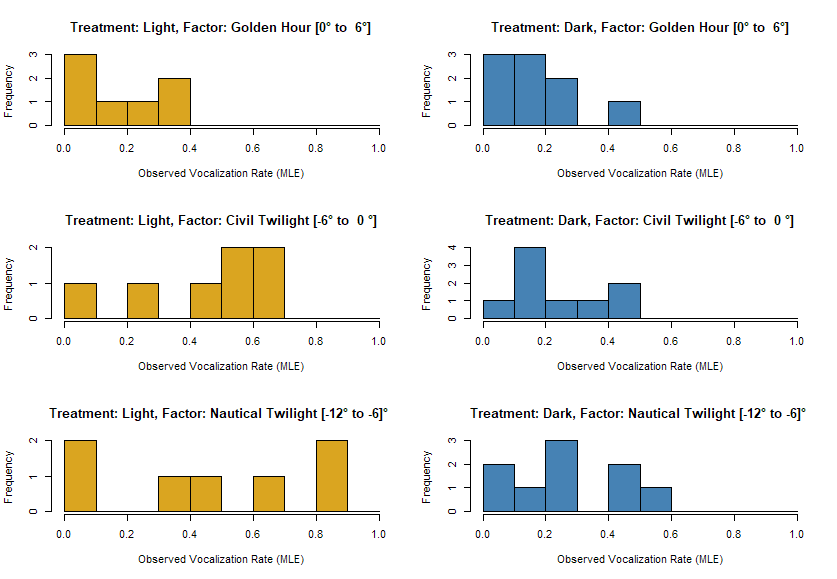
Figure 8. Histograms displaying the frequency of vocalization detection rates observed under light (n=7, left) and dark (n=9, right) treatments during the golden hour (top), civil twilight (middle), and nautical twilight (bottom) sun periods.
|

Figure 11. Spread of the maximum likelihood estimates (MLE) of the audible detection of Common Nighthawk wing booms observed in habitats with (n=7) and without (n=9) artificial light, with data grouped by sun class. Based on 10-12 one minute recordings per replicate.
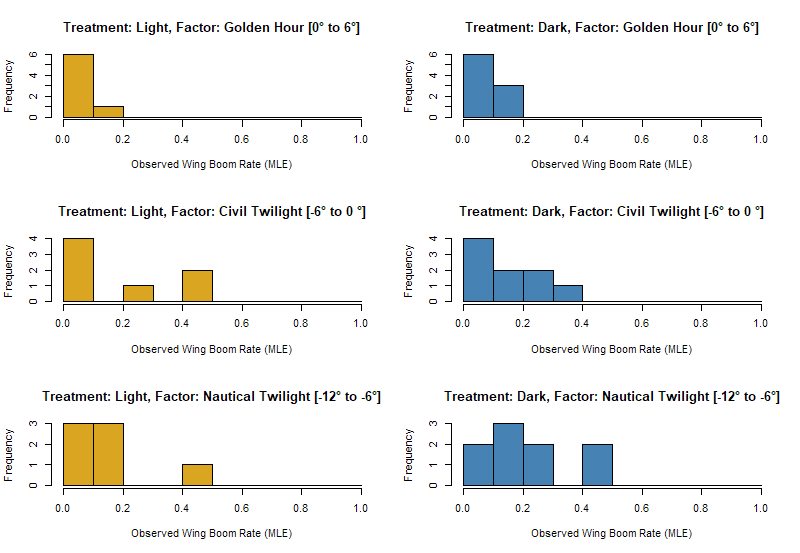
Figure 12. Histograms displaying the frequency of wing boom detection rates observed under light (n=7, left) and dark (n=9, right) treatments during the golden hour (top), civil twilight (middle), and nautical twilight (bottom) sun periods.
|
Likewise, wing boom detection rates were positively skewed in habitats without artificial light (Figure 11). Converse to the vocalization rates, wing boom detection rates tended to be negatively skewed at stations with artificial light except during civil twilight (Figure 12). There was less variation in wing boom detection rates between treatment groups compared to the vocalization detection rates. However, unequal variances persisted in the residual plot even when an inverse transformation was applied (Figure 13). 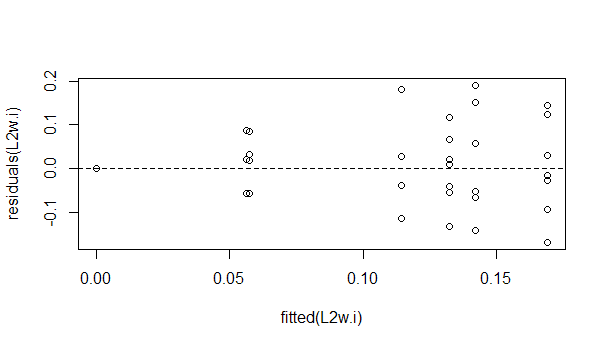
Figure 13. Residual plot of inverse-transformed wing boom detection rates in lit (n=7) and unlit (n=9) habitats, grouped by five sun periods.

|
Analysis Level Three: Location x Sun Class x AM/PM
|
There was a higher level of variation in the vocalization detection rates observed at stations with artificial light compared to those without throughout the third level of factorial analysis (Figure 14). Vocalization detection rates were normally distributed or positively skewed except under artificial light during the evening civil twilight period and in the dark during morning nautical twilight, for which the data were negatively skewed (Figures 15 and 16). The residual plot of vocalization detection rates observed across sun periods in the morning and evening in both lit and unlit habitats displayed unequal variances (Figure 17). This was slightly corrected with an inverse transformation; however, the transformation introduced a slight positive skew (Figure 18). It should be noted that no data was observed in the morning "golden hour", "faint light", or "bright light" sun periods so they were removed from this level of analysis. 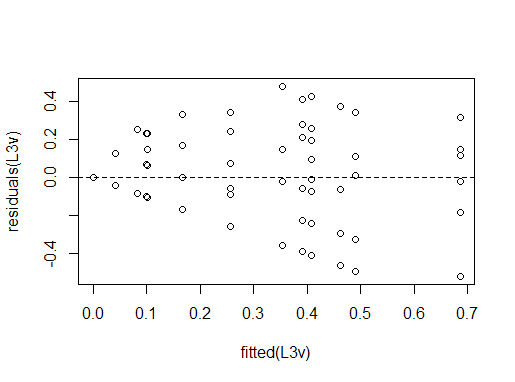
Figure 17. Residual plot of original vocalization detection rates in lit (n=7) and unlit (n=9) habitats, grouped by seven sun periods spanning from the evening dusk to the morning dawn.
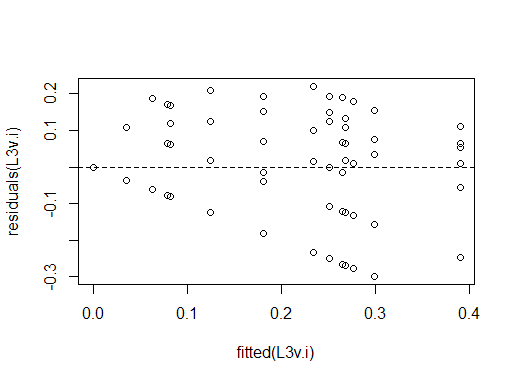
Figure 18. Residual plot of the inverse-transformed vocalization detection rates in lit (n=7) and unlit (n=9) habitats, grouped by seven sun periods spanning from the evening dusk to the morning dawn.
|

Figure 14. Spread of the observed maximum likelihood estimates (MLE) of the audible detection of Common Nighthawk vocalizations observed in habitats with (n=7) and without (n=9) artificial light, with data grouped by sun class in the evening and morning periods. Based on 4-6 one minute recordings per replicate.
Figures 15-16. Histograms displaying the frequency of vocalization detection rates observed under light (n=7, left) and dark (n=9, right) treatments during the golden hour (top), civil twilight (middle), and nautical twilight (bottom) sun periods in the morning and evening periods.
|
|
Figures 19-20. Histograms displaying the frequency of vocalization detection rates observed under light (n=7, left) and dark (n=9, right) treatments during the golden hour (top), civil twilight (middle), and nautical twilight (bottom) sun periods in the morning and evening periods.
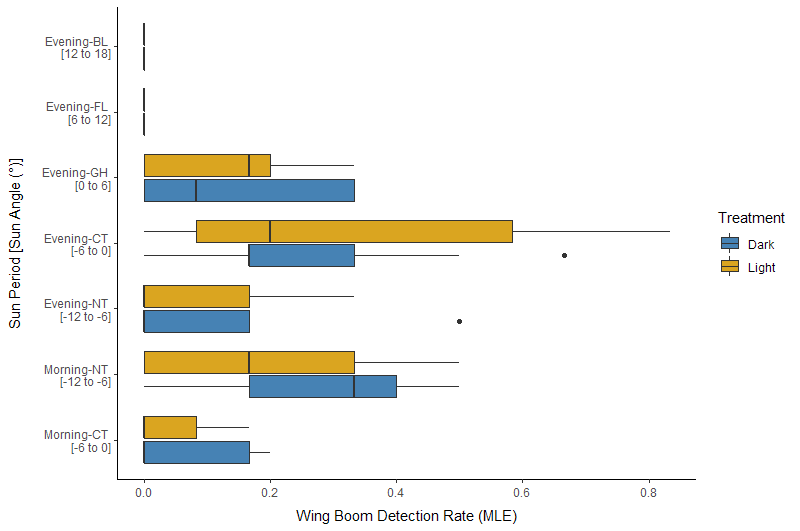
Figure 21. Spread of the observed maximum likelihood estimates (MLE) of the audible detection of Common Nighthawk wing booms observed in habitats with (n=7) and without (n=9) artificial light, with data grouped by sun class in the evening and morning periods. Based on 4-6 one minute recordings per replicate.
|
The rate of wing boom detection rates remained relatively consistent across sample populations and sun class periods (Figures 19-20). Though, considerable variation was seen during civil twilight in habitats under artificial light (Figure 21). A slight negative skew in wing boom detection rates was observed at stations without light during the morning nautical twilight period, which was counter to trends observed in other periods for this sample population. As with the other analyses, unequal variances were observed in the residual plot, for which an inverse transformation of the data had a negligible effect (Figure 22). 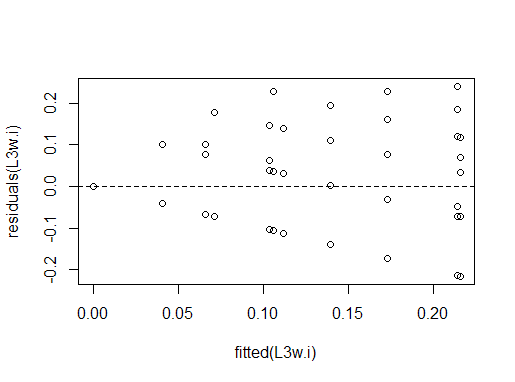
Figure 22. Residual plot of the inverse-transformed wing boom detection rates in lit (n=7) and unlit (n=9) habitats, grouped by seven sun periods spanning from the evening dusk to the morning dawn.
|
