Analysis Level One: Light Treatment
|
The first level of analysis compared the overall detection rates of Common Nighthawk activity between stations with and without artificial light, regardless of the timing of that activity (Figure 23). Visually, the mean detection rates between stations with (25.26% +/- 4.26%) and without (17.02% +/-2.73%) artificial light appeared to be different (Table 3). A one-sided t-test confirmed the significance with 90% certainty (α=0.1), t(10.4) = 1.4, p=0.094. Though conservative estimates, representing the lower confidence interval, of the predicted effects artificial light may have on vocalization detection rates are minute, with only a 70% chance of a 5% increase and a 40% chance of a 10% increase (Table 4). However, unequal variances in the data may have influenced the validity of the t-test results. So, non-parametric tests were conducted on data pooled between locations to determine if artificial light had an overarching influence on detection rates (Table 5). A two-sample Z-test for proportions revealed a higher level of certainty (α=0.05) in the significance of the difference between vocalization detection rates observed in habitats with artificial light (26.0%, 95% CI [21.5, 30.8]) and without (17.3%, 95% CI [13.9, 21.1]) (Figure 24). Following this non-parametric logic, without considering other habitat conditions, artificial light may be confidently correlated with up to a 7% increase in common nighthawk vocalization detection rates (Table 6).

Table 5. Contingency table used in the two-sample z-test for proportions using data pooled between all locations.

Figure 24. Results of the two-sample z-test for proportions with an estimated mean vocalization detection rate of 25.96% in habitats with artificial light and 17.29% in habitats without.
The reduced significance of the effects of artificial light observed in the results of the T-test compared to the Z-test allude to the possibility of an additional factor influencing the probability of common nighthawk vocalization detection. Common Nighthawk activity during the breeding season can vary significantly by latitude (Hannah et al., 2022). Despite the location of stations selected for analysis spanning a difference in latitude of fewer than three degrees, it appeared that latitude could be a confounding factor. 
Table 7. Non-parametric spearman correlation coefficients describing the relationship between latitude and common nighthawk detection rates in lit and unlit habitats.
|

Table 3. Descriptive statistics of observed vocalization and wing boom detection rates (MLE) observed in habitats with and without artificial light, expressed as percentages (%).

Figure 23. A comparison of the mean maximum likelihood estimates (MLE) of the audible detection of Common Nighthawk activity observed in habitats with (n=7) and without (n=9) artificial light based on 42-60 one minute recordings per location replicate.

Table 4. Increasing effect of artificial light on vocalization detection rates (MLE) at different confidence levels based on the results of a one-sided t-test.
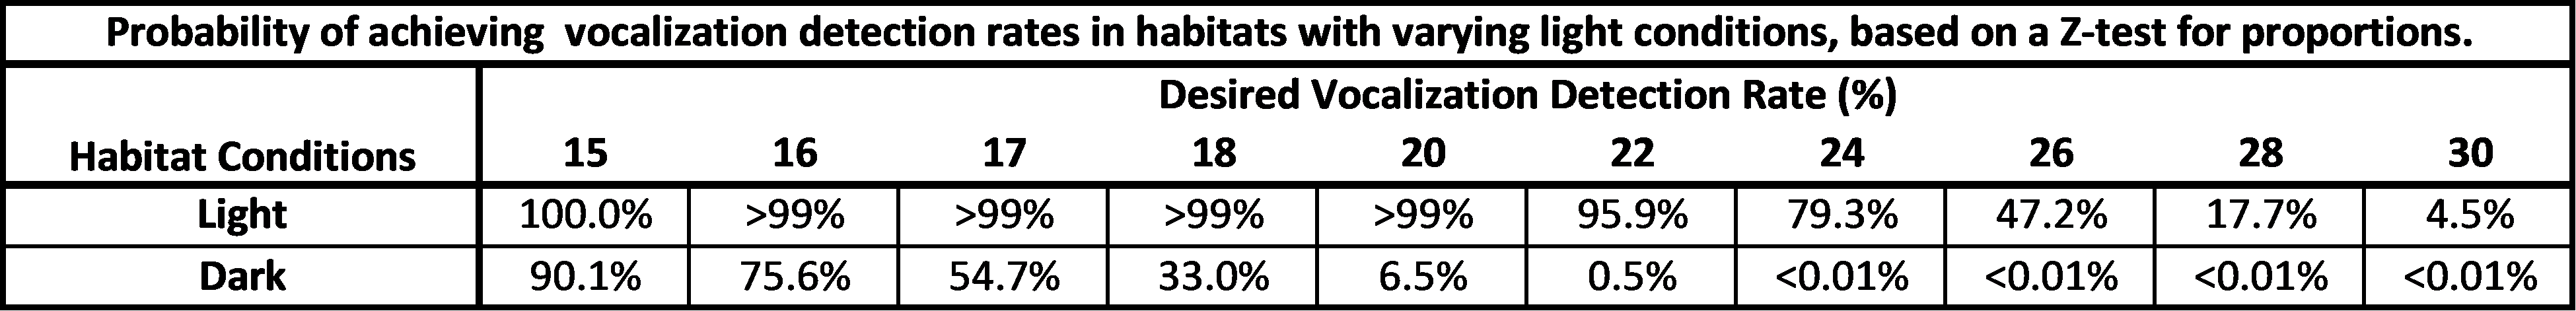
Table 6. The estimated effects of the presence of artificial light on achieving a spectrum of desired vocalization detection rates based on the results of the z-test of proportions (α=0.05).

Figure 25. Observed maximum likelihood estimates (MLE) of the audible detection of Common Nighthawk activity observed in habitats with (n=7) and without (n=9) artificial light at night (ALAN) across latitudinal positioning. Based on 42-60 one minute recordings per location replicate.
Five dark stations with lower vocalization detection rates existed at the southern end of this spectrum, while light stations exhibiting the highest vocalization detection levels predominated at the northern end of the spectrum, where civil twilight periods would be relatively longer and temporarily closer (Figure 25). Based on the Spearman correlation coefficients for non-parametric data, higher latitudes did appear to correspond with higher vocalization rates observed in illuminated habitats (Table 7). Evidence of the potential effects of latitude warranted its inclusion in assessing the effects of artificial light as a covariate, particularly on the vocalization detection rate. Despite the presence of non-parametric data, the Central Limit Theorem ensures that the sample means used for analysis are normally distributed, even if the population means are not. A one-way Analysis of Covariance (ANCOVA) confirmed that the presence of artificial light did not significantly affect the mean vocalization detection rate (F(1)=1.86, SS=0.34, p=0.17), but latitude did (F(1)=4.48, SS=0.082, p=0.04). However, the poor fit of the linear regression model (F(2, 76)=3.17, r2=0.08, residual SS =1.40 p=0.05) indicated that additional factors contributed to the observed variation.
|
Visually, there appeared to be no significant difference in the wing boom detection rate between light (8.85% +/- 2.29%) and dark (10.59% +/- 2.29%) stations (Figure 23). A two-sample t-test (t(12.75)= -0.51, p=0.69) confirmed the lack of significant effect of artificial light, as did a non-parametric two-sample Z-test for proportions, which observed a mean wing boom detection rate of 9.90% (99% CI [6.92, 13.63]) in illuminated habitats and 11.63% (99% CI [7.88%, 16.33%]) in dark habitats.
Analysis Level Two: Light Treatment x Sun Class
|
Visually assessing the vocalization detection rates across sun classes reveals higher levels of common nighthawk activity under artificial light during both civil twilight (with a detection rate of 47.19% +/- 8.32%) and nautical twilight (47.62% +/- 12.16%) compared to activity levels during the same periods in unlit habitats (25.54% +/- 4.50% and 28.45% +/- 6.48%, respectively) (Figure 26) (Table 8). However, these differences were no longer significant after controlling the treatment and factorial variables for latitude, and pooling their variances (Table 9). The only remaining trend of interest was the relative increase in the mean vocalization detection rate from golden hour to civil twilight, which was greater in illuminated (15.3% mean increase) than in dark (7.1% mean increase) habitats. 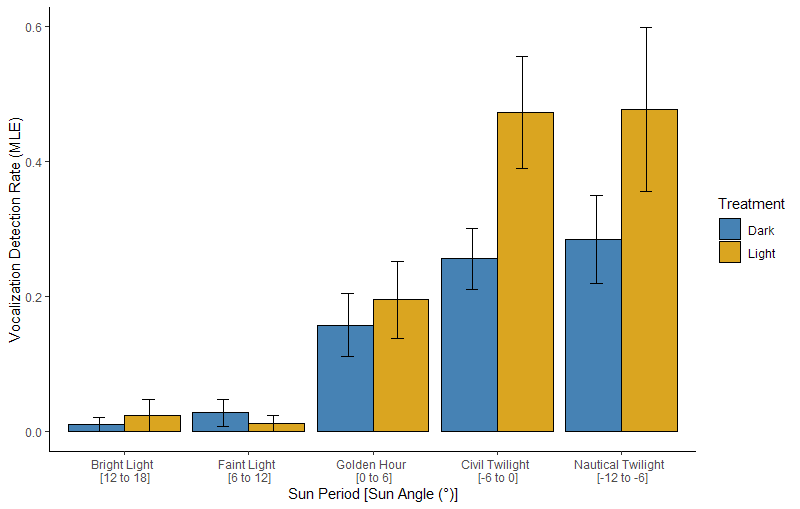
Figure 26. A comparison of the mean maximum likelihood estimates (MLE) of the audible detection of Common Nighthawk vocalizations observed in habitats with (n=7) and without (n=9) artificial light, with data grouped by sun period. Based on 10-12 one minute recordings per replicate.
A factorial ANOVA used the inverse-transformed common nighthawk vocalization data to compare the effects of the presence of artificial light in combination with the sun period while controlling for latitude. The inclusion of the sun class accounted for a larger portion of the variation compared to the first level of analysis based on the residuals (df=68, SS=0.54). As expected, sun class had the most significant effect on the variation (F(4)=25.68, SS= 0.81, p=<0.001). The significance of the effects of latitude (F(1)=10.71, SS= 0.08. p=0.005) increased with the variation accounted for by the sun period, as did light (F(1)=4.31, SS=0.03, p=0.08). However, the interaction between the presence of artificial light and the sun period did not seem to significantly explain the variation in vocalization detection rates (F(4)=1.33, SS=0.04, p=0.27). Note that the reported p-values were adjusted for multiple inferences using the Holm method. A regression analysis of the multiple linear regression provided a considerable increase in statistical compared to the first level of analysis at 0.644 and an overall increase in confidence in the model (F(10,68)=12.31, r2=0.644, residual SS = 0.54, p<0.001). |
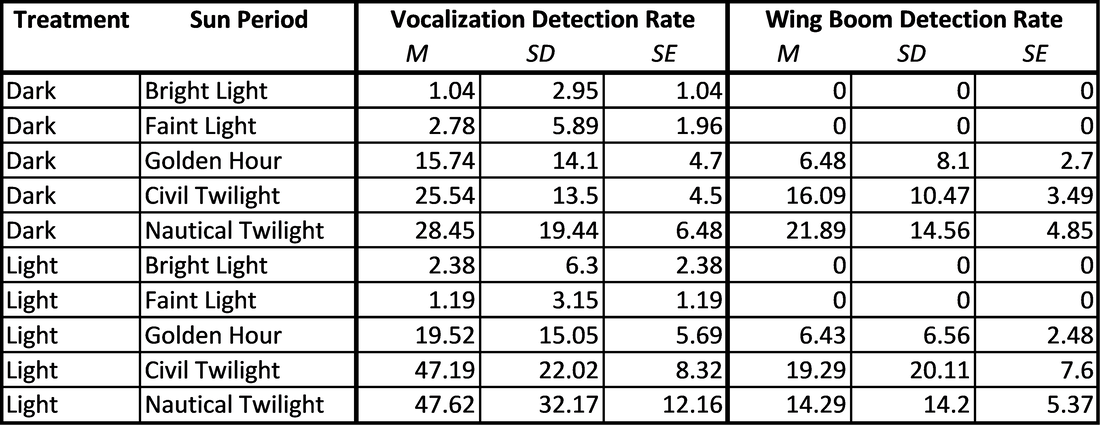
Table 8. Descriptive statistics of the vocalization and wing boom detection rates (MLE) observed across sun periods in artificially illuminated and dark habitats, expressed as percentages.
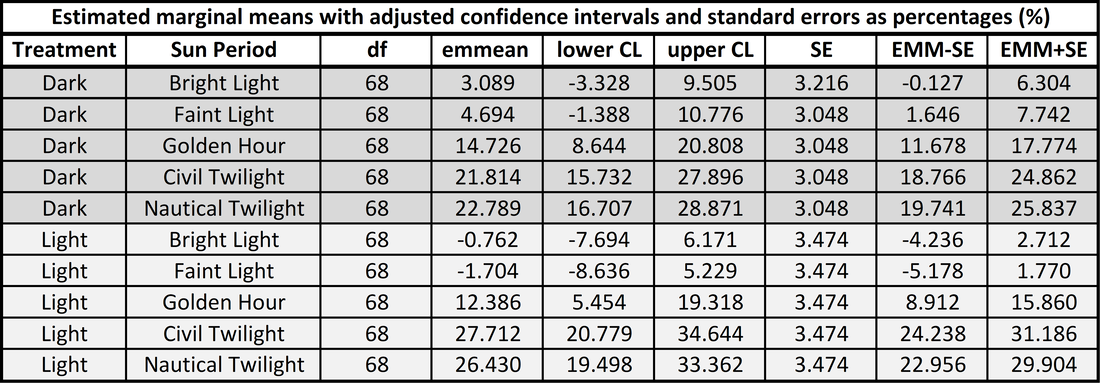
Table 9. The estimate marginal mean common nighthawk vocalization detection rate observed in light and dark habitats across sun periods obtained by controlling for latitude and pooling variances.
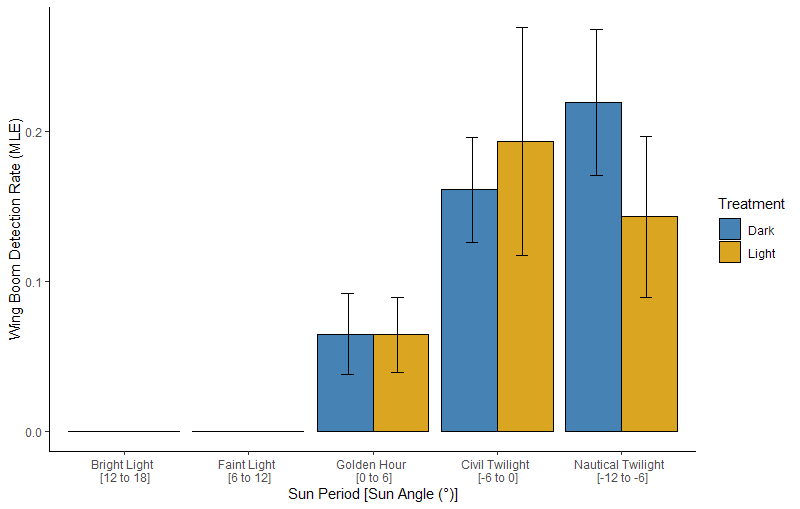
Figure 27. A comparison of the mean maximum likelihood estimates (MLE) of the audible detection of Common Nighthawk wing booms observed in habitats with (n=7) and without (n=9) artificial light, with data grouped by sun period. Based on 10-12 one minute recordings per replicate.
As suggested by the first analysis, artificial light had no observable effect on wing boom detection rates, even during varying sun class periods (Figure 27). As expected, the inverse-transformed and multiple-inference-adjusted multifactor ANOVA showed only the sun period to have a significant effect on wing boom detection rates (F(4)=15.05, SS=0.31, p=<0.01). The multiple linear regression model accounted for much less of the observed variation in wing boom detection rates than it did for vocalizations (F(10.68)=6.27, r2=0.48, residual SS = 0.35, p=<0.01). |
Analysis Level Three: Light Treatment x Sun Class x AM/PM
|
To honestly examine the effects of ALAN on Common Nighthawk activity, the timing of different sun classes in relation to the evening sunset and morning sunrise must be considered. Typically, foraging occurs during dusk, but dawn may be utilized at lower latitudes where the civil twilight period is shorter, resulting in bimodal activity patterns (Hannah et al., 2022). It is important to note that factorial categorization of the available data significantly reduced sample sizes to 4-6 recordings per station replicate of detection rates, resulting in dramatically reduced precision. Morning bright light, faint light, and golden hour were removed from this level of analysis as no data were obtained in these periods. Any trends observed at this level should be assessed with larger sample sizes for verification.
Partitioning vocalization detection rates between evening and morning periods emphasized the difference in vocalization detection rates observed between artificially illuminated (68.57% +/- 10.46%) and naturally dark (40.74% +/- 9.26%) habitats during the evening civil twilight (Figure 28). A similar effect was observed, though to a lesser extent, in the evening nautical twilight (Table 10). The estimated marginal means were not obtainable for the complexity of this model, considering the scope of this undergraduate researcher.
A multifactor ANOVA on the inverse-transformed data found the most significant factors in explaining the observed variation to be the sun period (F(4)=25.27, SS=1.24, p=<0.001), whether the detections occurred in the morning or evening (F(1)=27.83, SS=0.34, p=<0.001) and the interaction of these two variables (F(4)=10.12, SS=0.50, p=<0.001). Beyond the timing of detection, latitude for the majority of remaining variation (F(1)=8.65, SS=0.11, p=0.02). Following the holm adjustment for multiple inferences, the effect of light was not considered significant at an alpha level of 0.05 (F(1)=5.67, SS=0.07, p=0.08). This model was not as strong as the one presented in the previous level of analysis, likely due to high degrees of freedom introduced by multiple variables and interactions (F(20,122)=9.8, r2=0.62, residual SS = 1.49, p=<0.001).
|
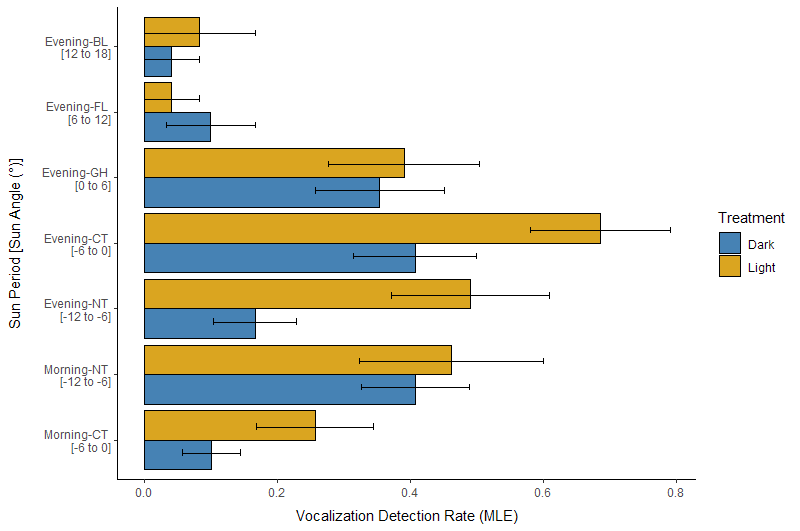
Figure 11. A comparison of the mean maximum likelihood estimates (MLE) of the audible detection of Common Nighthawk vocalizations observed in habitats with (n=7) and without (n=9) artificial light at night (ALAN), with data grouped by sun class in the evening and morning periods. Based on 4-6 one minute recordings per replicate.
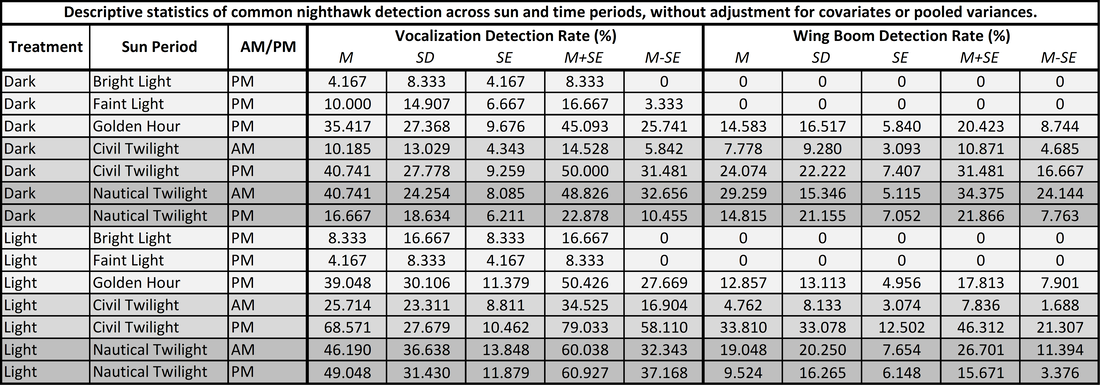
Table 10. Descriptive statistics of the vocalization and wing boom detection rates (MLE) observed across sun periods in the morning and evening in artificially illuminated and dark habitats, expressed as percentages.

Figure 12. A comparison of the mean maximum likelihood estimates (MLE) of the audible detection of Common Nighthawk wing booms observed in habitats with (n=7) and without (n=9) artificial light at night (ALAN), with data grouped by sun class in the evening and morning periods. Based on 4-6 one-minute recordings per replicate.
|
The only significant variables influencing the observed variation in common nighthawk wing boom detection after adjusting for multiple inferences were the sun period (F(4)=13.68, SS=0.47, p=<0.001) and the interaction between the sun period and the morning or evening period (F(4)=7.58, SS=0.26, p=<0.001). Like with the vocalization detection rates, the strength of the multiple linear regression model lessened by overfitting with too many predictor variables and interactions (F(20,122)=4.723, r2=0.43, residuals SS = 1.06, p=<0.001).
