Data Acquisition & Selection
Acoustic data was first evaluated by automated acoustic signal recognition programs (SongScope, WildTrax), the results of which were visually and audially verified by human observers. Automated signal recognition has proven to be an effective means of evaluating presence-absence and vocalization rate for the Common Nighthawk, which has simple and consistent auditory signals (Knight et al., 2017). A total of 472 ARU stations had records of Common Nighthawk detections during the same two month breeding season (June and July, 2014).
The level of artificial light at night of each station was estimated using the Visible Infrared Imaging Radiometer Suite (VIIRS) nighttime light products developed by the Earth Observation Group at the Colorado School of Mines. VIIRS collects mid-to-longwave infrared data emitted from the earth’s surface every 24 hours using day/night band (DNB) technology and combines these satellite images to produce monthly and annual estimates of surface radiance that have been filtered for cloud cover, background noise (e.g., aurora), solar and lunar contamination, and sources of non-electric lighting (e.g., fires, flares, volcanoes) (Elvidge et al., 2017). This project utilized annual VIIRS measurements of surface radiance (nW/sr²cm²) averaged over 500 metre pixels. Stations associated with a radiance level greater than 0.5 nW/sr²cm² were categorized as having artificial light present, since this is the common radiance detection threshold for low light DNB spectral bands (Elvidge et al., 2019).
|
|
Of the 472 stations that had detected Common Nighthawks, there were 12 stations with artificial light (“light” stations) that were also situated a minimum of two kilometres away from each other. An equivalent number of “dark” stations (that did not meet the ALAN radiance threshold) situated at least two kilometres away from the light stations and each other were randomly selected. Due to significant overlap (11/12 light stations) with a project assessing other forms of anthropogenic disturbance on avian communities, only dark stations that were also associated with this project were selected to avoid possible confounding factors. The additional light station, with an original purpose of monitoring Yellow Rails, was maintained to ensure adequate sample sizes.
The presence of Common Nighthawks was assessed across time, measured as the sun angle relative to the horizon and grouped into five diel periods in increments of six degrees (see below section on Data Preparation) surrounding both dusk and dawn for a total of 10 diel periods. Six one minute recordings in each of the 10 diel periods (for a total of up to 60 recordings, as ARU recording schedules permitted) at each of the 24 stations were visually scanned by a human observer for the presence of Common Nighthawk detections. Stations where Common Nighthawk detections were rare (i.e., where less than 5% of the recordings contained Common Nighthawk detections) were omitted from further analysis to reduce the possibility of zero-inflation. This methodology resulted in a total of 7 light stations and 9 dark stations (see adjacent map). |
Data Preparation
In order to address the research questions, three factorial levels of analysis were conducted. In all analyses, the presence of artificial light was the experimental predictor variable and each station was considered an independent replicate for the two sample populations: Common Nighthawks using habitat with artificial light (n=7) and Common Nighthawks using habitat without artificial light (n=9). The number of recordings assessed per station replicate (survey effort) ranged from 42 to 60, for a total of 817 recordings, which was divided into factorial subgroups for the second and third levels of analysis.
To account for uneven survey effort, presence/absence data at each station was converted to a detection rate specific to the level of analysis being conducted (Table 1). This detection rate represents the maximum likelihood estimate (MLE) of detection, as described by Hauser et al. (2015), which was considered an appropriate proxy for comparing the relative level of habitat use (response variable) for the scope of this project. Previous studies have found that wing booms are always accompanied by a vocalization (Knight et al., 2022). This was fairly congruent with preliminary analyses of this project’s data, of which only six recordings (3.4%) registered wing booms without a vocalization. Thus, the detection rate of vocalization or wing boom (combined) was not assessed.
To account for uneven survey effort, presence/absence data at each station was converted to a detection rate specific to the level of analysis being conducted (Table 1). This detection rate represents the maximum likelihood estimate (MLE) of detection, as described by Hauser et al. (2015), which was considered an appropriate proxy for comparing the relative level of habitat use (response variable) for the scope of this project. Previous studies have found that wing booms are always accompanied by a vocalization (Knight et al., 2022). This was fairly congruent with preliminary analyses of this project’s data, of which only six recordings (3.4%) registered wing booms without a vocalization. Thus, the detection rate of vocalization or wing boom (combined) was not assessed.
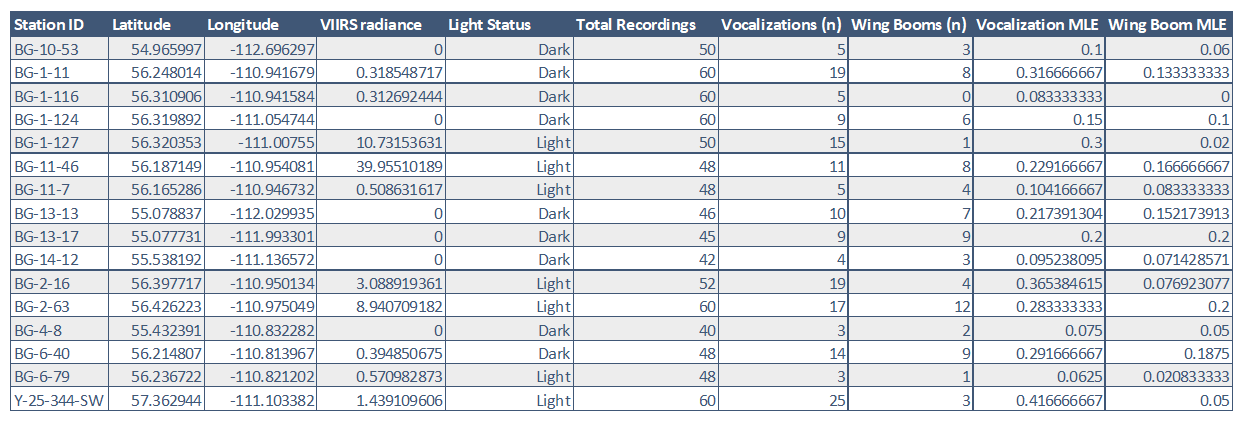
Table 1. Summary of station (replicate) information and example detection rate (MLE) calculation for the first level of analysis.
|
The first analysis compared the overall detection rates of Common Nighthawk vocalizations and wing booms between light and dark stations. Subsequent levels of analysis considered the timing of Common Nighthawk, measured as the sun’s angle in relation to the horizon and grouped into five “sun classes”, spanning 6° sun angle increments. The five sun classes included three commonly understood diel periods (golden hour, civil twilight, and nautical twilight) and two additional classes created for the purposes of assessment (faint light and bright light) (Table 2, Figure 2). While all recordings were captured within the same two month period, assessing time in this way ensured consistency across seasonal and latitudinal differences. Additionally, Common Nighthawks tend to be most active during civil twilight (Hannah et al., 2022). Thus, measuring the timing and frequency of activity in relation to the sun’s angle is also a more realistic way of understanding the potential effects of variations of lighting in the environment. |

Table 2. "Sun Classes" used in analyses, defined as six-degree increments of the sun's angle relative to the horizon.
|
|
The second analysis looked at activity in sun class broadly, while the third analysis further separated sun classes as they related to the evening sunset and morning sunrise. While the third analyses is beneficial for fully understanding the effects of ALAN on Common Nighthawk activity, low survey effort at this factorial level lead to considerable variation (see Data tab). The number of recordings per station x sun class factorial combination for the Golden Hour (GH), Civil Twilight (CT), and Nautical Twilight (NT) ranged from 10-12 for the second analysis and 4-6 for the third analyses. An insufficient number of recordings were collected during the Bright Light (BL) and Faint Light (FL) periods to offer a fulsome assessment in either analyses, even when combined into a single Daylight (DL) sun class, but were included in the results for comparison.
|
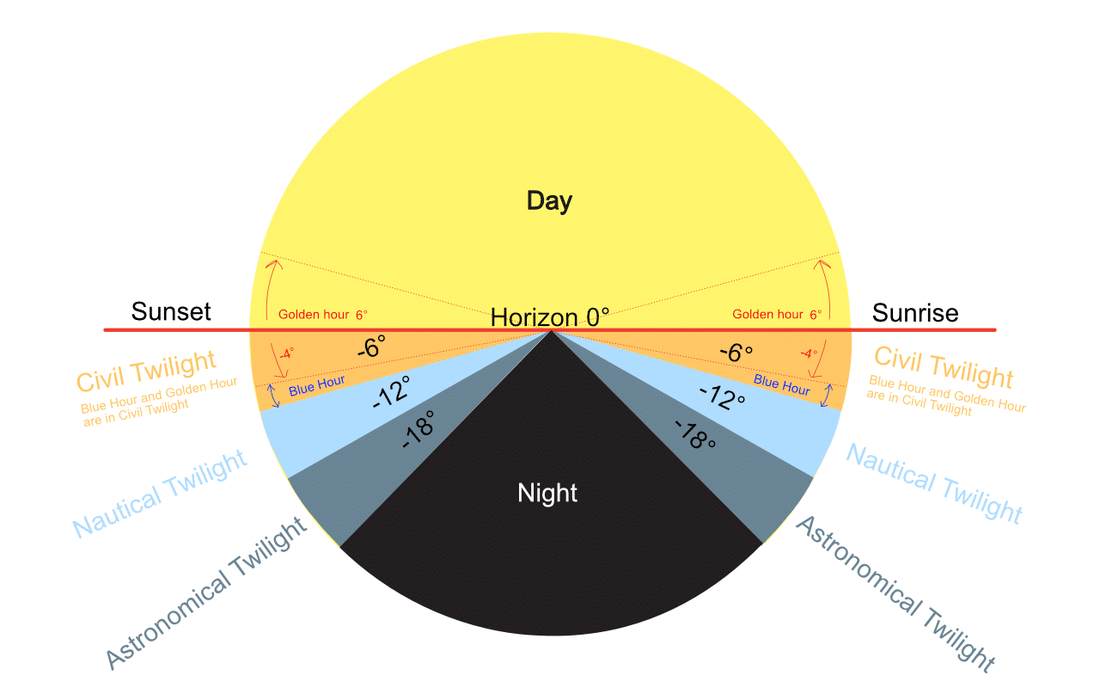
Figure 2. Sun light periods (Mark Unrau).
|
